
The pirate funnel, or AAARRR framework, is an essential tool used by today’s growth marketers.
In this post, I’ll explain what it is, how to use it, and how it can lead you to buried treasure (or at least help grow your business). Also, from here on out, I’ll try to refrain from using any more cliché pirate jokes (so hard!).

TLDR; The Pirate Funnel Explained < 30 Seconds
What Is the Pirate Funnel?
It’s a framework that breaks the entire customer journey down into six key stages. It is referred to as the Pirate Funnel because the first letters of those six stages spell out AAARRR.
What Does AAARRR stand for?
AAARRR is the first letter of each stage in the Pirate Funnel:
- Awareness
- Acquisition
- Activation
- Revenue
- Retention
- Referral
Why Use the Pirate Funnel?
Growth marketers use the Pirate Funnel because it allows them to quickly identify their biggest bottleneck or growth opportunity, align their team’s priorities, and focus their efforts where they will see the most impact.
What Comes After the Pirate Funnel?
The Pirate Funnel helps you answer where your biggest bottleneck lies. After that, it’s time to answer why the bottleneck exists, come up with possible ways to resolve the problem, and test your ideas through experimentation.
What Is the Pirate Funnel?
The Pirate Funnel is a framework originally developed by venture capitalist, Dave McClure. He came up with a simple model to help businesses understand their customer’s journey and the metrics they should be paying attention to if they want to understand where they are underperforming along that journey.
The Pirate Funnel is simple model to help businesses understand their customer’s journey and the metrics they should be paying attention to if they want to understand where they are underperforming along that journey.
His model included five basic stages: Acquisition, Activation, Revenue, Retention, and Referral. The first letter of these five stages forms the acronym AARRR. Sounds like something a pirate says and thus the reference to this framework as the Pirate Funnel.
Since Mr. McClure’s original introduction, a sixth stage has been added - Awareness. This allowed us to see how many people that were exposed to our brand were actually engaging and becoming leads.
The original order of the stages were Acquisition, Activation, Retention, Revenue, and Referral. Different marketers and companies view the funnel differently and based on the your company’s business model, you may wish to rearrange them according to what works best for you.
That said, for most B2B SaaS companies, I have found the ideal order to be Awareness, Acquisition, Activation, Revenue, Retention, and Referral. This follows the natural marketing and sales cycle of most companies and is most likely to be accepted as it follows the chronological progression of a customer. I will elaborate more on each of these funnel stages.
6 Levers of Growth - AAARRR Framework
The Pirate or AAARRR framework consists of six key stages. These are the stages your customers typically move through on their journey to become your customer. You may also wish to think of these stages as levers of growth as each can be addressed and manipulated individually for better performance.

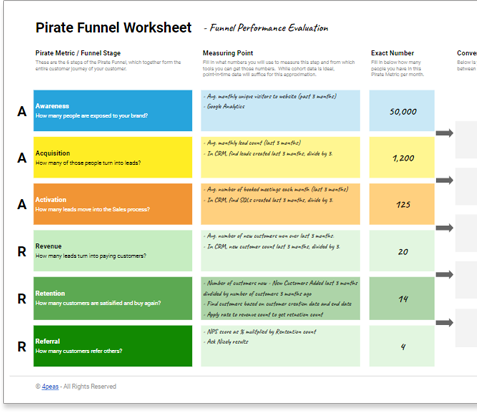
The six Pirate Funnel stages or levers of growth are as follows:
- Awareness — How many people are exposed to your brand?
- Acquisition — How many of those that engage with your brand become leads
- Activation — How many leads move into the sales process?
- Revenue — How many of those that enter the sales process turn into paying customers?
- Retention — How many paying customers are satisfied and continue using your product or service?
- Referral — How many customers turn into raving fans and tell their colleagues about your company/products?
If you’re like me, after the first time I was introduced to the pirate funnel, you’re probably thinking a couple of things. Maybe you’re thinking, “Wow! An awful lot happens within that Revenue stage. Shouldn’t it be broken down into several smaller stages to capture what is happening between the booked meeting and that initial discovery call?” or “Wouldn’t it be nice to know how many of these resulted in dollarized opportunities?”
Maybe you’re thinking about all the different factors that go into the conversion rate at each step and how different they may be for each combination of buyer persona, channel, and source. Those are great questions and I’m thrilled if that is how you are already thinking. Just know that using the Pirate Funnel with the six key stages is like a doctor or mechanic running general tests so that they can isolate the problem to a specific area and conduct more specific and detailed tests. That is the goal of the Pirate Funnel, which leads me to why we use the Pirate Funnel at all and why it is so valuable to those that wish to grow their business.
Why Use the Pirate Funnel? What Makes It So Valuable?
As mentioned, the Pirate Funnel consists of six key steps or stages. Although you can and should eventually add sub-steps within each of these to isolate specific bottleneck areas, the power of the Pirate Funnel is in its simplicity.
By examining only the six primary stages of a customer’s journey, you can avoid unnecessary confusion and delay in identifying the area of greatest growth opportunity in your business. By populating your funnel metrics, seeing the conversion rates between each step, and identifying your biggest bottleneck, you can quickly address the part of your customer’s journey that is negatively impacting your business.
By examining only the six primary stages of a customer’s journey, you can avoid unnecessary confusion and delay in identifying the area of greatest growth opportunity in your business.
Using the Pirate Funnel helps you from getting bogged down in the minutia of marketing. It provides focus and clarity as to what your next step should be. I hope I’ve conveyed the value of using this simple framework to provide guidance on where you should be focusing your efforts. I’ll now share a more detailed, step-by-step set of instructions on how to use the Pirate Funnel Worksheet.
How To Use the Pirate Funnel Worksheet: Step-by-Step
Okay, so I’ve tried to make this as easy for you as possible by providing you with a worksheet that you can simply download and populate. I’ve seen other funnel worksheets out there but decided to build this one because the others all shared the same critical flaw. They all assumed the lowest conversion rate between stages was your biggest bottleneck. That might be true if all stages were expected to convert at the same rate. That, however, is simply not realistic. With an all-industry, visitor-to-lead conversion rate under 3%, the Acquisition stage would likely always be flagged as your bottleneck.
An additional column has been added to identify your true bottleneck based on performance relative to industry averages or targeted benchmarks. I’ll be going through each step in detail, so if you would like, download your copy of the worksheet and follow along.
- Define & Match Funnel Stages
Although you may take liberties with adding, removing, and rearranging the steps within the Pirate Funnel, it is advised that you not do so at this point. Keep it simple, but complete. Resist the urge to refine the funnel and add complexity.
Your job right now is to simply ensure your definitions of what constitutes a lead, customer, etc. are understood and align with your reported metrics. For example, if you import contacts into your CRM from a data vendor like ZoomInfo, make it clear whether or not this record should be considered a lead or not. I have strong opinions on this but will save them for another blog post. - Calculate Your Funnel Stage Counts
Now it’s time to visit Google Analytics, your CRM, or whatever source you have chosen to calculate the right number for each stage of your Pirate Funnel. Accuracy is always desirable but remember that progress is always better than perfection.
You will also want to ensure you are consistent in regard to the time period you are calculating for. Using a longer period of time may remove anomalies caused by seasonality or one-off events, but may skew results due to capturing metrics from how things “used to be done”. If you’ve made any significant changes like redesigning your website or adding a nurture email campaign, you may want to capture data following such changes.
In the Marine Corps, I was introduced to the KISS principle. KISS is an acronym for “Keep it simple, stupid”. It states that most systems work best if they are kept simple. You should adhere to this principle when deciding on how to report on your funnel stage metrics.
For example, the awareness stage is about brand exposure. Although you could attempt to calculate the number of people exposed to your brand through all paid and organic media including social platforms like Twitter and LinkedIn, it would be much easier and advisable to simply report on the number of unique visitors to your website. Keep in mind that this is not a once-and-done exercise, but something you will reproduce on a regular basis to see if your efforts have made an impact on removing the identified bottleneck.
Another thing you may be contemplating is using a cohort report vs a point-in-time report. If you are not familiar with the term, a cohort is a group of users who share a common characteristic that is identified in the report by an analytics dimension. An example of a cohort might be all leads captured during the same time period. While this may be the most accurate way to capture conversion rate metrics, it may prevent you from capturing the impact of more recent changes due to the length of your sales cycle. Again, the goal is to measure the effects of your marketing efforts. Take this into consideration before becoming too rigid in how or what time period you choose to report on. - Set Industry Average or Target Benchmarks
So mentioned above, most Pirate Funnel worksheets look only at the conversion rates between stages and identify the lowest value as your bottleneck. This would only be an accurate assessment if all stages were expected to convert at similar rates. Since average visitor-to-lead conversion rates are typically under 3% and customer retention rates are over 75%, you can see how this is not a good way to identify your true bottleneck.
A quick Google search can reveal industry-specific, funnel conversion rate benchmarks. It would be ideal if you find benchmarks where the stages are well-defined and match your criteria since there is such variance in how companies define and calculate these numbers.
If you cannot locate benchmarks for your industry, some cross-industry benchmarks have been included as worksheet defaults.
Visitor-to-Lead Conv. Rate 3% Lead-to-SQL Conv. Rate 5% SQL-to-Customer Conv. Rate 6% Avg. Customer Retention Rate 75% Avg. NPS Score 44
As you progress on your growth marketing journey, you will likely exceed industry benchmarks and will then want to replace these benchmarks with your own internal goals. Remember to set realistic, attainable goals as these new benchmark figures will determine your new area of focus and growth opportunity. - Identify Your Biggest Bottleneck / Growth Opportunity
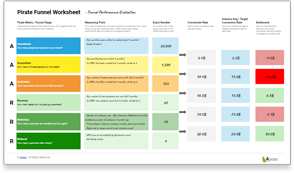
Now comes the fun part! You’ve done the heavy lifting. You populated your funnel metrics and comparison benchmarks and the worksheet has calculated the percentage difference between your funnel conversion rates and the benchmark metrics supplied.
If you exceeded the benchmark, the background color will be light green and indicate you are performing well in this stage of the funnel. Good job! If your conversion rate was below the benchmark, the background color will be light red and indicate this is a stage of the funnel that could use some work.
The lowest percentage difference between your reporting conversion metrics and the benchmark values will have a background color that is bright red. This indicates your biggest bottleneck and number one growth opportunity. This is the stage where you should focus your efforts. - Bonus: Refine Funnel Steps & Segment
Okay, so you’ve worked through the Pirate Funnel worksheet and you’ve identified where the biggest bottleneck lies within one of the six pirate funnel stages. You may not be surprised. You may have already known you were underperforming in a particular stage but now need help to identify where the bottleneck within that stage lies. Good news! It’s rinse and repeat using the same process but using sub-stages and segmenting your numbers by buyer persona, channel, source, etc.
Sub-Stages
So if you had identified the Acquisition stage as your bottleneck but are now looking to find the bottleneck within the Acquisition stage, you could begin by substituting the Pirate Funnel stages with the sub-stages found within your Acquisition stage.
For example, in order to become a lead, someone may have to engage with a CTA and visit a landing page with a form on it. You could identify sub-stages as visiting your website, engaging with a CTA, visiting a landing page, filling out a form, and lastly submitting a form. Most of that data can be collected and reported from within Google Analytics.
You may quickly see that you are doing quite well getting your website visitors to visit your landing pages but are failing to get them to fill out and submit the form.
Segmenting by Persona, Channel, Source
A bottleneck may also be associated with a particular buyer persona, channel, source, device type, etc. By segmenting your data accordingly, you may find that your message is simply not resonating with a particular persona or that those on a mobile device are finding the experience challenging. It is only through digging a bit deeper and segmenting the data that we find these gems (oh, so close, really wanted to throw in a pirate reference there).
Bottleneck Identified. What Next?
Once you have identified your biggest bottleneck, that is when the fun really begins. You now possess the clarity of knowing what funnel stage is most problematic and that you must do something to improve your efficiency within this stage of the customer journey.
You can now choose to further refine your funnel analysis to isolate more specifically where the problem lies or you can begin the experimentation process. Experimentation is an indepth topic that I won’t cover in this post, but is a critical component of growth marketing.
Pirate Funnel Worksheet
Quickly identify the bottlenecks in your customer funnel.
- Identify your biggest bottleneck and opportunity for growth.
- Align and focus your team's efforts.
- New! Compare to industry or target benchmarks.
Pirate Funnel Worksheet
Get the tool that will help you quickly identify the bottlenecks in your customer funnel.
- Identify your biggest bottleneck and opportunity for growth.
- Align and focus your team's efforts.
- New! Compare to industry or target benchmarks.
 Download Worksheet
Get Growth Marketing Articles, Tips & Tricks
(sent directly to your inbox)


Pirate Funnel Worksheet
Get the tool that will help you quickly identify the bottlenecks in your customer funnel.
- Identify your biggest bottleneck and opportunity for growth.
- Align and focus your team's efforts.
- New! Compare to industry or target benchmarks.
Download Worksheet